Work Zone Data
Fatal Crashes
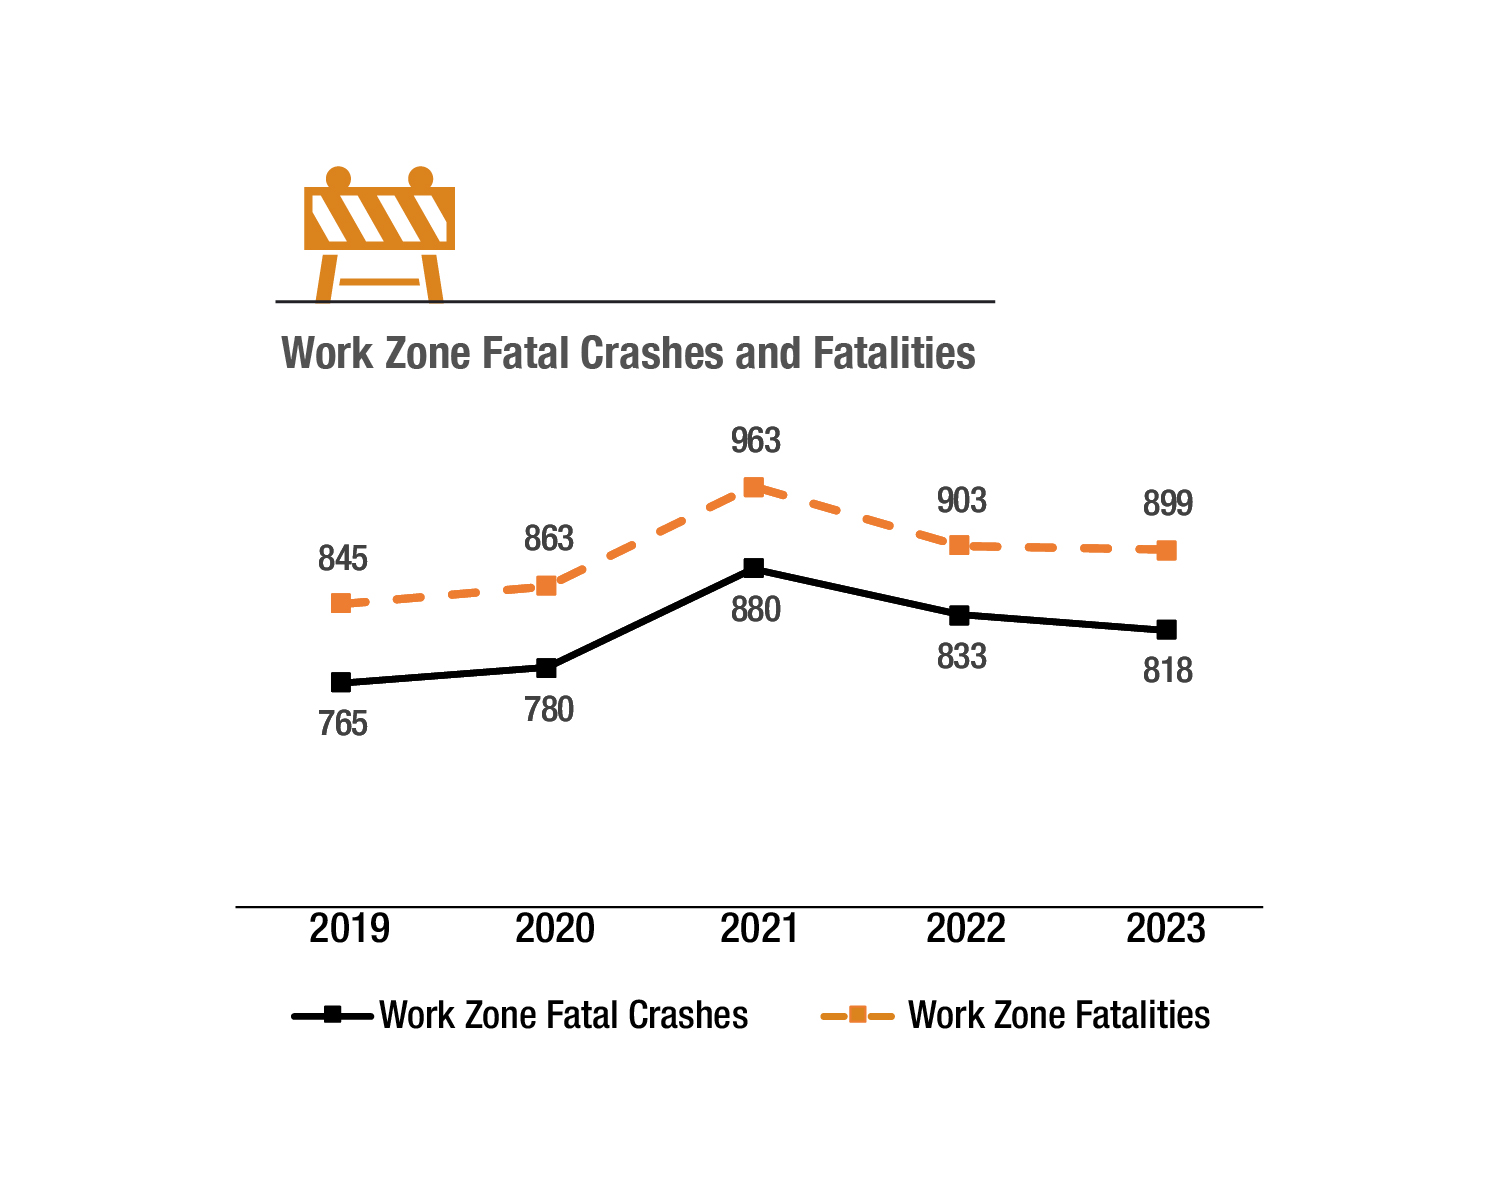
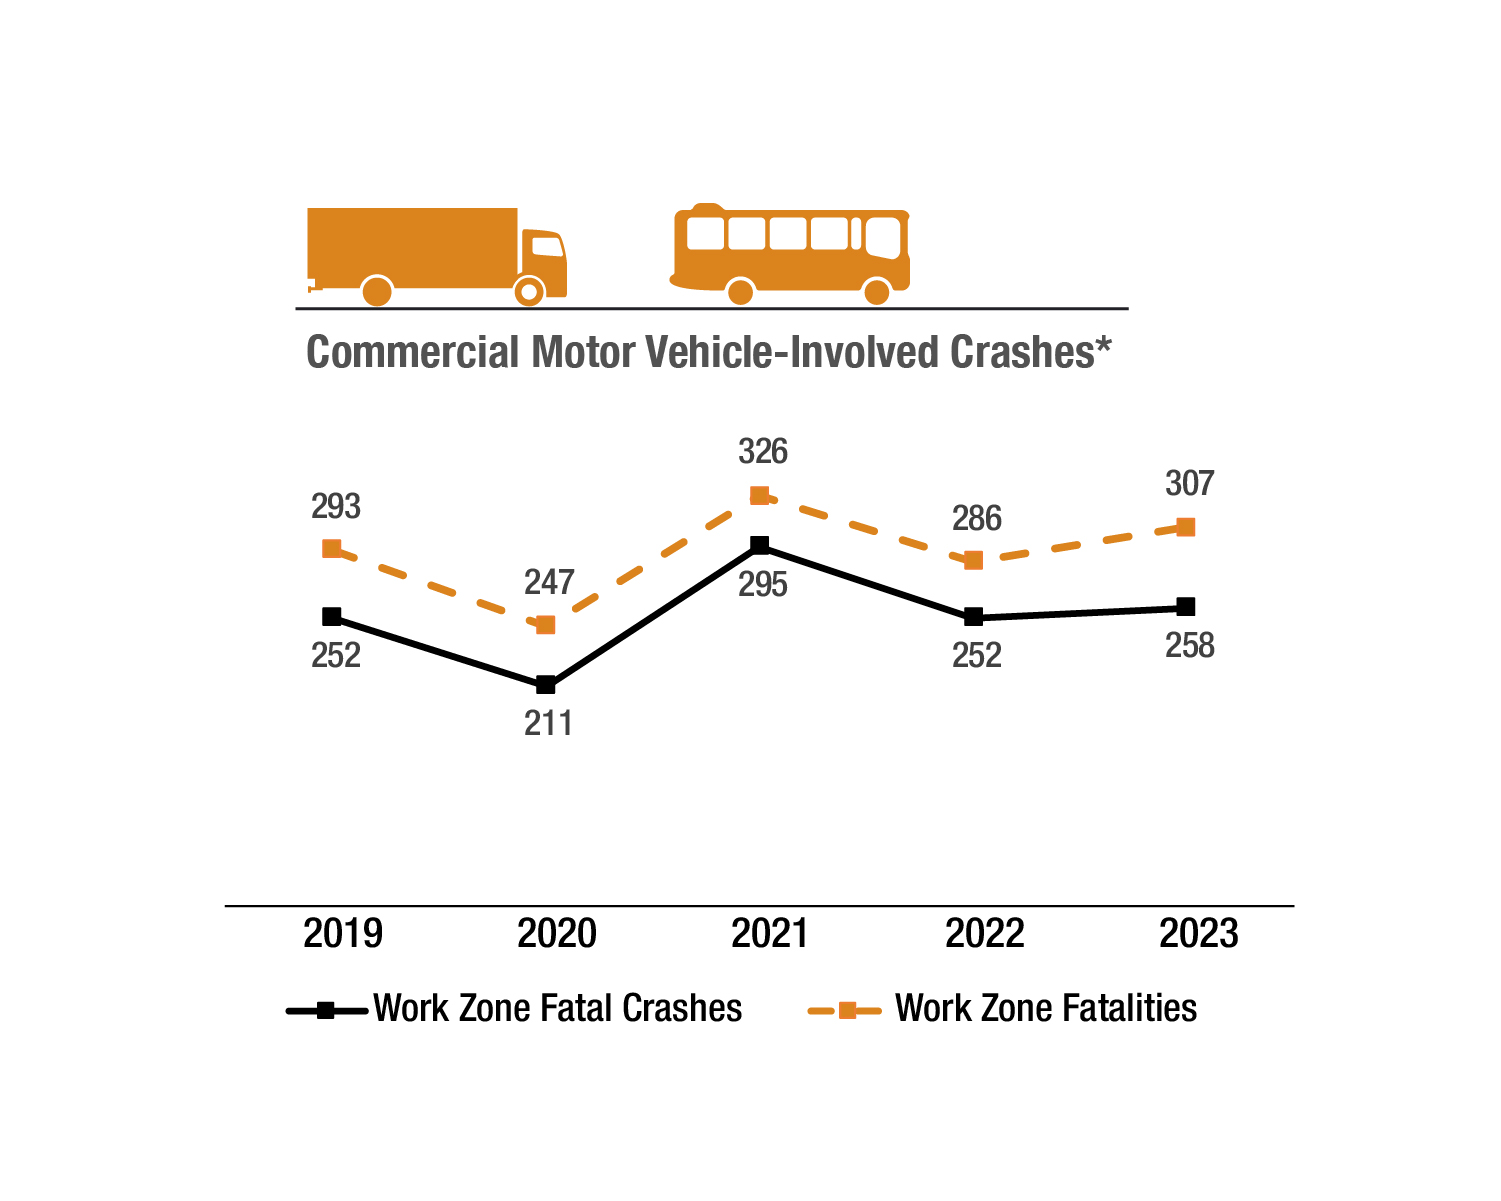
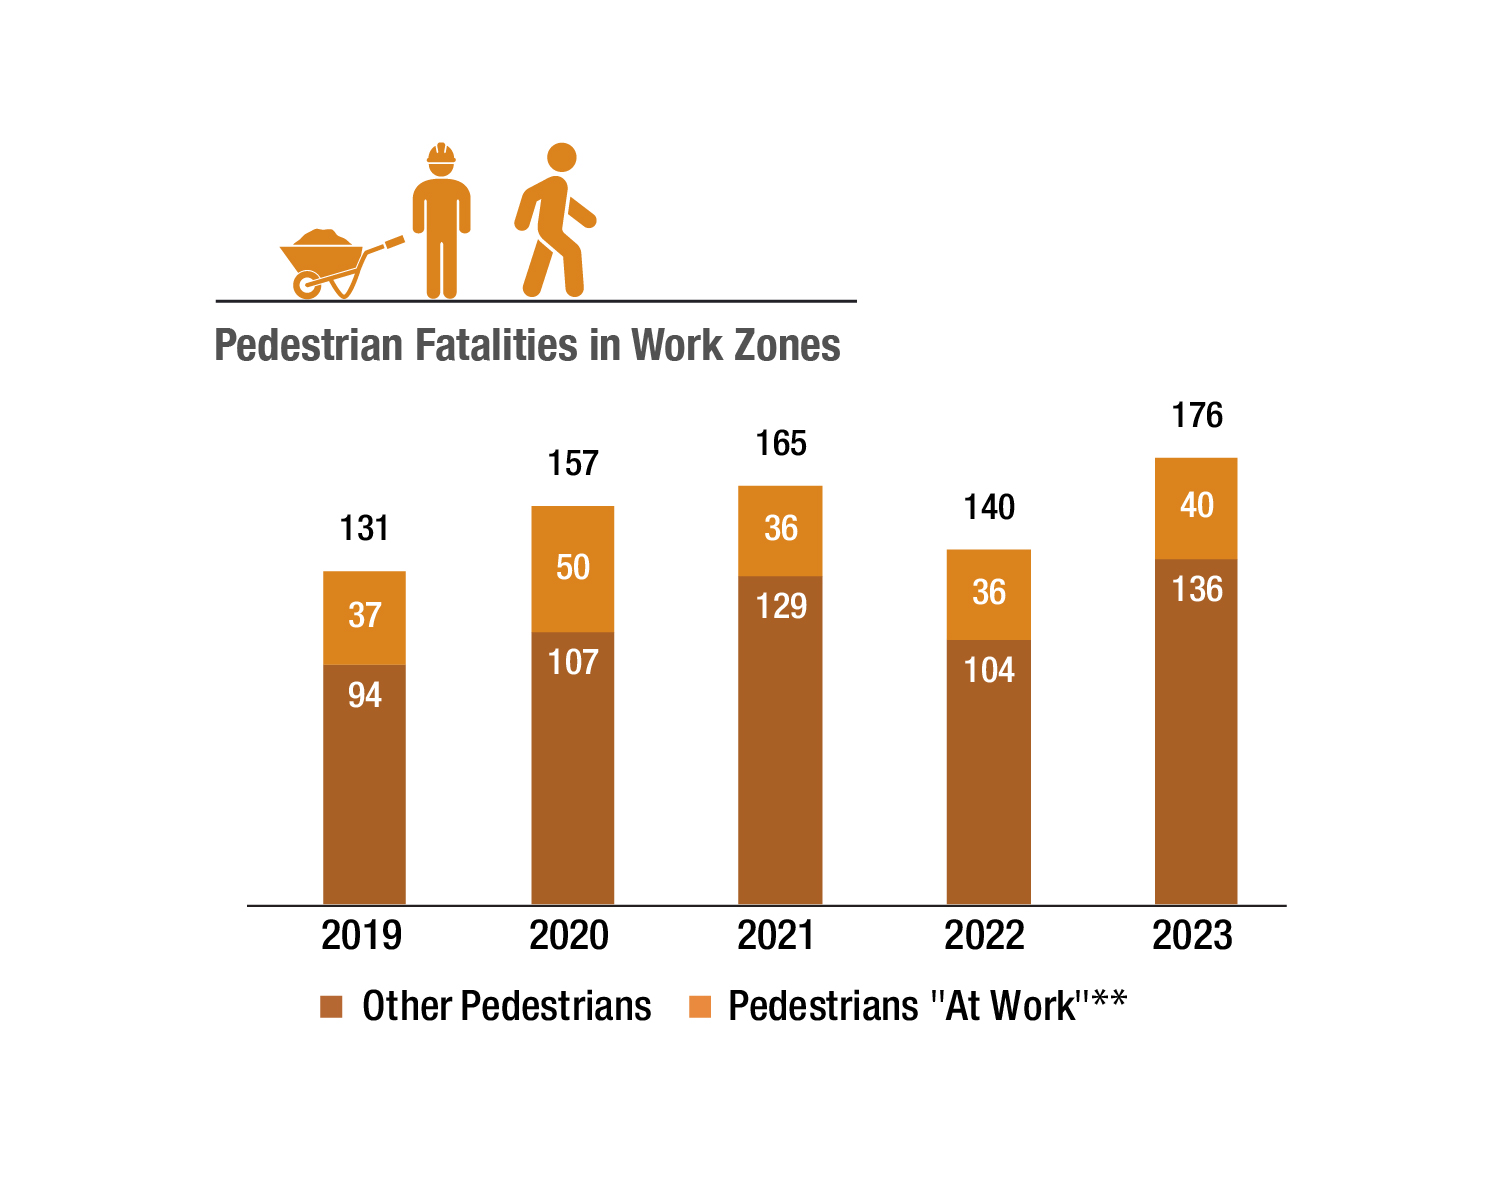
Source: Fatality Analysis Reporting System (FARS), National Highway Traffic Safety Administration, U.S. Department of Transportation. The 2019-2022 data were taken from the FARS final data files, while the 2023 data were from the FARS 2023 Annual Report File [ARF]. All data were downloaded in April 2025.
*Commercial motor vehicles consist of large trucks with gross vehicle weight ratings of more than 10,000 pounds and buses.
** Pedestrians identified in FARS as being at work or a construction/maintenance/ utility worker or a transportation worker (e.g., maintenance workers, safety service patrol operators). Other analyses indicate up to 38 percent of pedestrian fatalities in work zones are highway workers (2018 data-industry report).
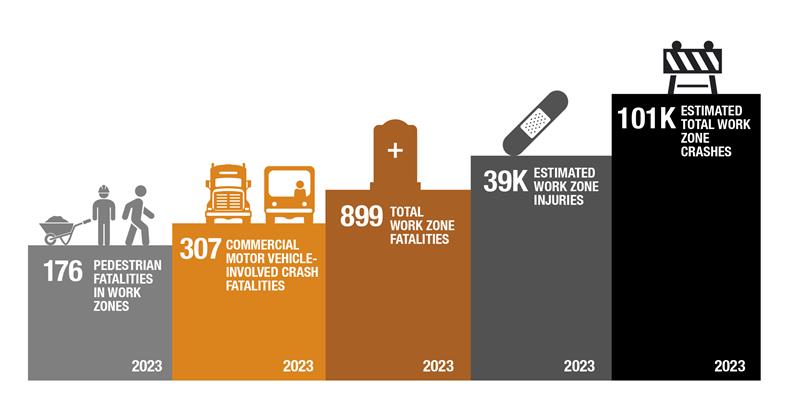
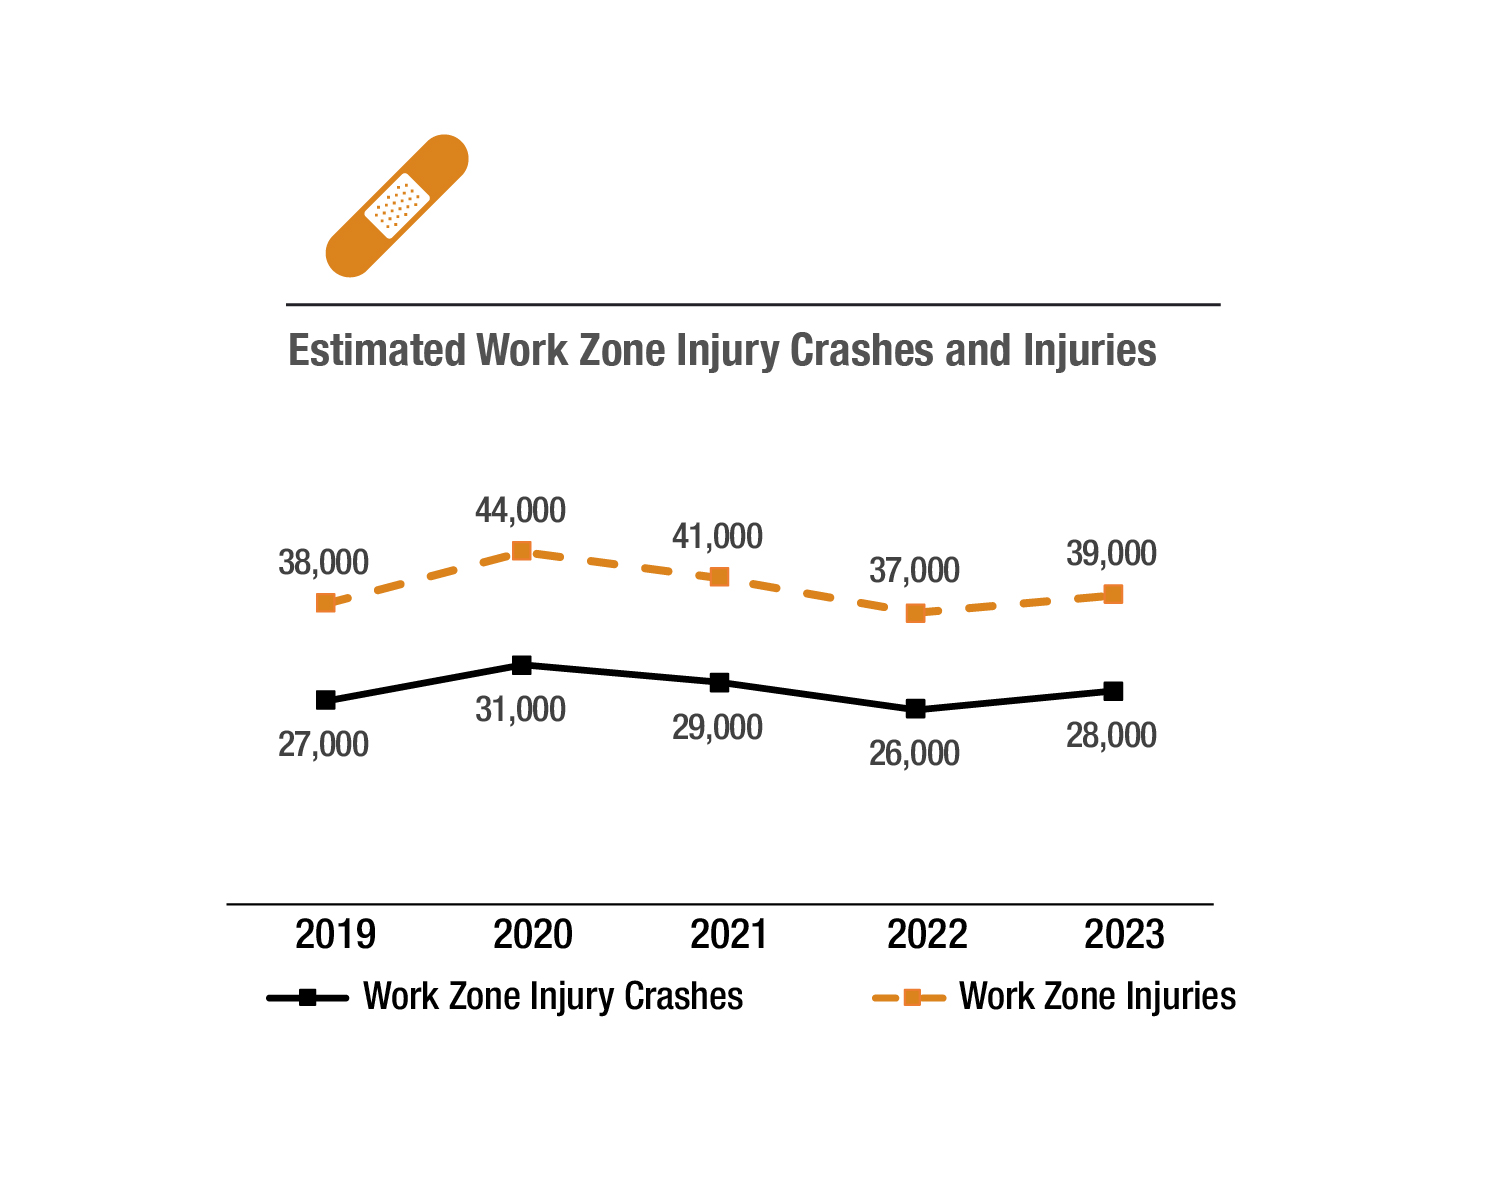
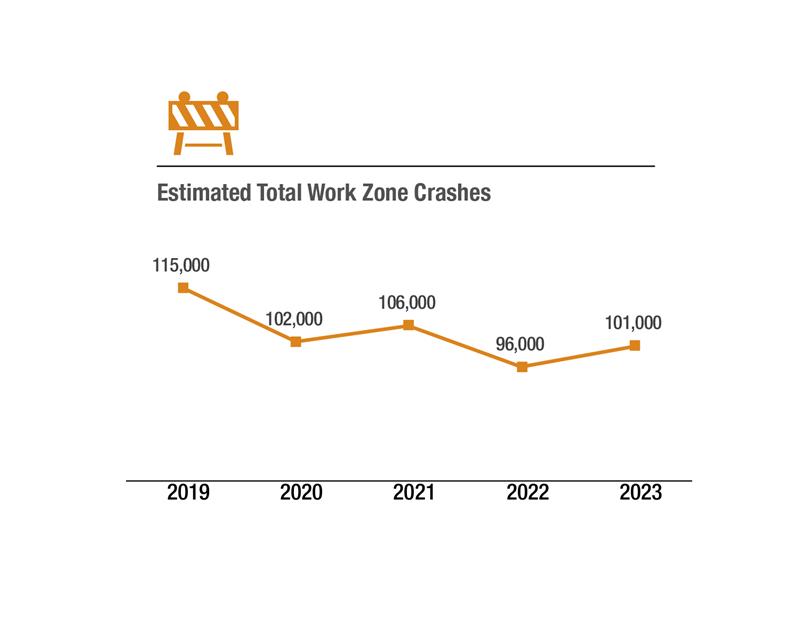
Source: Crash Report Sampling System (CRSS), National Highway Traffic Safety Administration, U.S. Department of Transportation. All data were downloaded in April 2025.
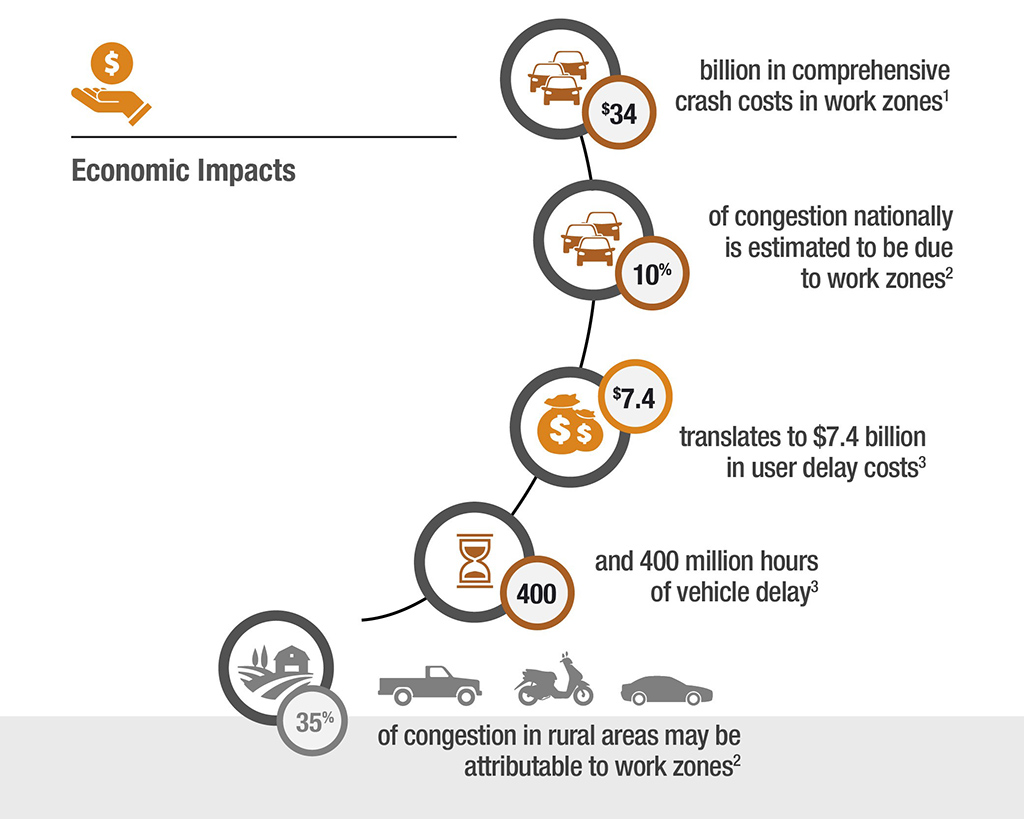
1 This figure is an estimate of the comprehensive crash costs (including both economical and societal costs) based on the number of fatalities, injuries, and property damage only crashes that were work zone related in 2023 and the approximate costs per crash severity type. The estimated cost per fatality comes from the Departmental Guidance on Valuation of a Statistical Life in Economic Analysis. The lifetime comprehensive cost to society for each fatality in 2023 was $13.2 million. The estimated cost per injury level is calculated using the proportion of the value of a statistical life (VSL) by injury level from the Departmental Guidance Treatment of the Value of Preventing Fatalities and Injuries in Preparing Economic Analyses multiplied by $13.2 million. Proportions of crashes by injury level were retrieved from an Association for the Advancement of Automotive Medicine article. Multiplying the estimated cost per injury level by the proportions of crashes by injury level produced an estimated total comprehensive cost per injury crash. Property damage only costs are estimated to be $18,000 per crash, based on this National Safety Council guide.
2 Kartikeya, J., and L. Albert. Congestion Pie Chart for Different Sources of Congestion. Technical Memorandum submitted to the Support for Urban Mobility Analysis Federal Highway Administration Pooled Fund Study. Texas A&M Transportation Institute, College Station, Texas, August 2021.
3 Computed using data from the INRIX 2024 Global Traffic Scorecard, assuming work zones contribute 10 percent to national congestion estimates.
Data Sources
Crash data shown here come from the 50 states, the District of Columbia, and Puerto Rico. The numbers for fatal crashes come from the Fatality Analysis Reporting System, National Highway Traffic Safety Administration, U.S. Department of Transportation. The numbers for estimated injuries, injury crashes, and total crashes come from the Crash Report Sampling System (CRSS), National Highway Traffic Safety Administration, U.S. Department of Transportation. CRSS provides only national estimates of work zone crashes and may underrepresent the actual numbers of work zone injuries and crashes that occur.
